FUSION: StatsMeasurementsService healthPlatformOpen consoleESFusion Software

See the systems behind the numbers.

Operational measurements and service healthBring traffic, server logs, uptime, SEO health, service levels, synthetic checks, runtime traces, and alerts into one operator console.
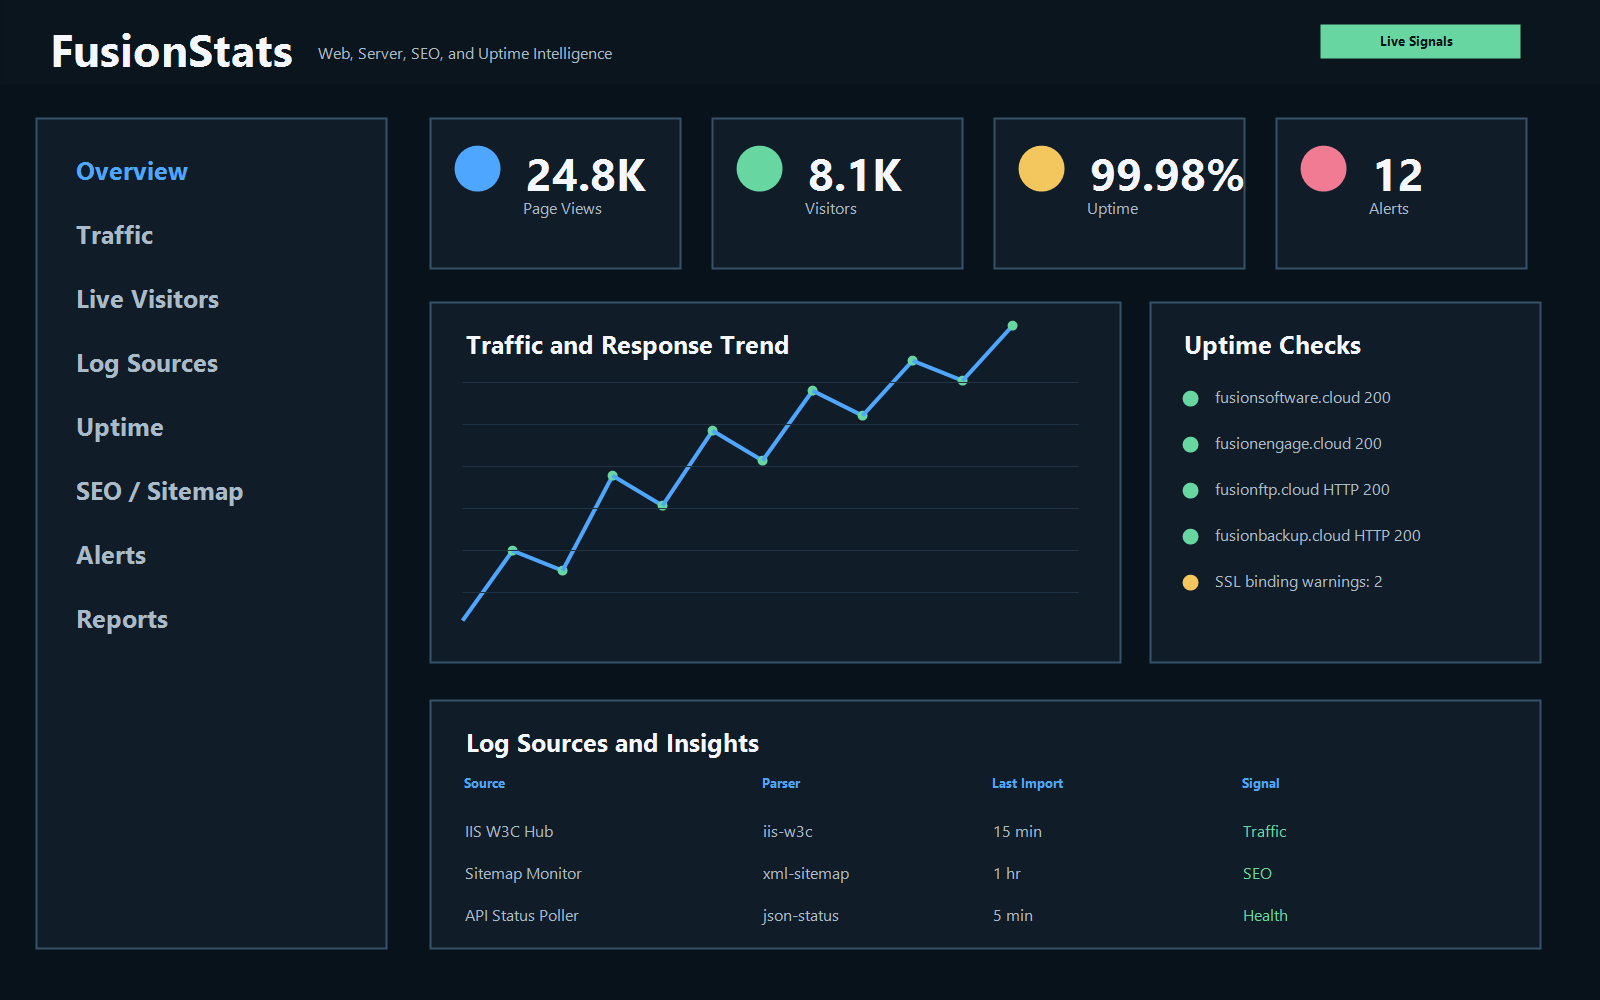
FUSION: Stats operator dashboard with service health, traffic, uptime, and incidents

From a slow page to the evidence that explains it.

Measurements remain connected to checks, logs, incidents, services, and the systems that produced them.

Traffic and behavior

Visits, routes, referrers, bots, bandwidth, status codes, downloads, APIs, and conversion events.

Availability and response

HTTP output, expected content, latency, DNS, TLS, APIs, sitemaps, and product status.

Evidence-led diagnostics

Connect findings to raw logs and check history so operators can explain spikes, errors, and risk.

Answer the questions that arrive before the incident ticket.

Operational questions

Is it up?

01Confirm reachability, response time, expected content, DNS, and certificate health.

What changed?

02Compare traffic, errors, crawlers, bandwidth, endpoints, and response trends.

Who is affected?

03Narrow findings by site, route, source, geography, product, or audience type.

What happens next?

04Alert the right channel, preserve evidence, create work, and verify recovery.

Logs, application signals, uptime checks, and sitemap findings in one place.

Connected evidence sources

Web and API

IIS events, routes, status codes, traffic, downloads, APIs, and response time.

Service health

HTTP probes, expected content, dependencies, runtime traces, and node metrics.

Search visibility

Sitemaps, robots rules, canonical URLs, metadata, crawlability, and TLS state.

Fusion products

Authorized backup, transfer, communication, workflow, and platform-health signals.

Measure the service from the outside and the inside.

Synthetic transactions, uptime probes, runtime traces, real-user measurements, service-level objectives, dependency checks, node metrics, and alert lifecycles create a fuller operational picture.

Check

Poll URLs, APIs, DNS, TLS, maps, robots rules, and expected content.

Collect

Normalize logs, runtime telemetry, product signals, and node measurements.

Alert

Route actionable findings through FUSION: Engage and Command.

Confirm

Verify recovery and preserve the evidence behind each incident state.

Statistics for operators; analysis for broader decisions.

FUSION: Stats focuses on direct website, server, log, uptime, SEO, service-level, and product-health measurements. FUSION: Analyze uses authorized signals to derive broader trends, explanations, forecasts, and recommendations.

FUSION: Analyze

Deeper trends, anomaly detection, forecasts, executive views, and cross-product intelligence.

FUSION: Engage

Deliver alerts through email, messaging, voice, queues, and connected communications.

FUSION: Command

Turn findings into owned work with evidence, responsibilities, deadlines, and outcomes.
Product overview